
Why high static pressure increases fan power, reduces airflow and creates problems that are often blamed on the AHU or cooling coil
In HVAC systems, most engineers regularly monitor chilled water temperature, AHU supply air temperature, room temperature and humidity. But one parameter that is often ignored until there is a problem is static pressure.
A fan does not consume power only because it is moving air. It consumes power because it has to move that air against resistance.
That resistance comes from filters, cooling coils, dampers, ducts, bends, transitions, HEPA filters, VAV boxes, grilles and other components in the air path.
When this resistance becomes higher than the design condition, the fan has to work harder to maintain the required airflow.
This is where static pressure becomes an energy issue.
A system may still maintain room temperature and humidity, while the AHU fan is operating at a higher speed and consuming significantly more power than necessary.
For an energy engineer, therefore, static pressure is not only a commissioning parameter.
It is an energy performance parameter.
1. The Ground Reality
A common approach during HVAC troubleshooting is:
Room temperature high → increase fan speed.
Or:
Airflow low → increase VFD frequency.
This may temporarily improve airflow, but it does not answer the actual question:
Why is the system requiring more fan pressure to deliver the same airflow?
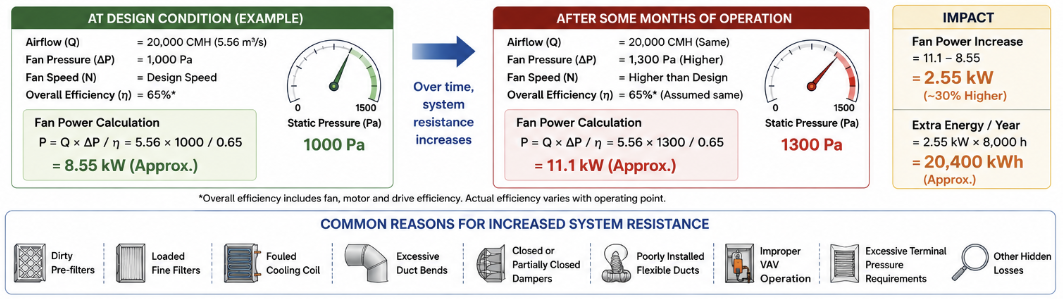
Consider an AHU that was designed for:
- Airflow = 20,000 CMH
- Fan pressure = 1,000 Pa
- Fan efficiency = 65%
After a few months of operation, the same AHU may be running at:
- Airflow = 20,000 CMH
- Fan pressure = 1,300 Pa
- Fan speed = higher than design
The cooling load has not changed.
The required airflow has not changed.
But the fan is consuming more power.
The additional power is not creating additional useful cooling. It is overcoming additional resistance in the air system.
Typical causes include:
- Dirty pre-filters
- Loaded fine filters
- Fouled cooling coils
- HEPA filter loading
- Undersized ducts
- Excessive duct bends
- Poor AHU inlet/outlet connections
- Closed or partially closed dampers
- Excessive air velocity
- Poorly installed flexible ducts
- Improper VAV operation
- Excessive terminal pressure requirements
This is why static pressure needs to be looked at as part of the overall HVAC energy balance.
2. What Is Static Pressure?
Static pressure is the pressure exerted by the air independent of its velocity.
In HVAC systems, it is commonly measured in:
- Pa
- mmWG
- in. WC
In an AHU, the fan generates a pressure rise that is consumed by the resistance of the air distribution system.
A simplified representation is:
Fan → Filter → Cooling Coil → Duct → Damper → Terminal → Room → Return → AHU
Every component in this path contributes some pressure loss.
The fan must provide enough pressure to overcome these losses while delivering the required airflow.
This is why two AHUs delivering the same airflow can have completely different fan power requirements.
One may be operating at 700 Pa.
Another may require 1,200 Pa.
The airflow is the same.
The pressure requirement is not.
3. Static Pressure, Velocity Pressure and Total Pressure
These three terms should not be mixed.
Static Pressure
Pressure associated with the thermodynamic state of the moving air and measured relative to a reference.
Velocity Pressure
Pressure associated with the kinetic energy of the moving air.
It is approximately:
where:
- (Pv) = velocity pressure
- (ρ) = air density
- (V) = air velocity
The important point is:
Velocity pressure increases with the square of velocity.
If air velocity increases by 20%, velocity pressure increases by approximately:
Pv∝V2
Therefore, if air velocity increases by 20%: V2=1.2V1
So velocity pressure increases by 44%.
This is one reason why reducing unnecessary air velocity can have a meaningful impact on system pressure drop.
Total Pressure
For a simplified duct-flow analysis:
Pt=Ps+Pv
where:
- Pt = total pressure
- (Ps) = static pressure
- (Pv) = velocity pressure
In practical HVAC troubleshooting, understanding which pressure is being measured and where the measurement is taken is critical.
A pressure reading without a defined measurement location is not very useful.
4. The Static Pressure Budget
Every HVAC system has a pressure budget.
The fan generates the available pressure.
The system consumes it.
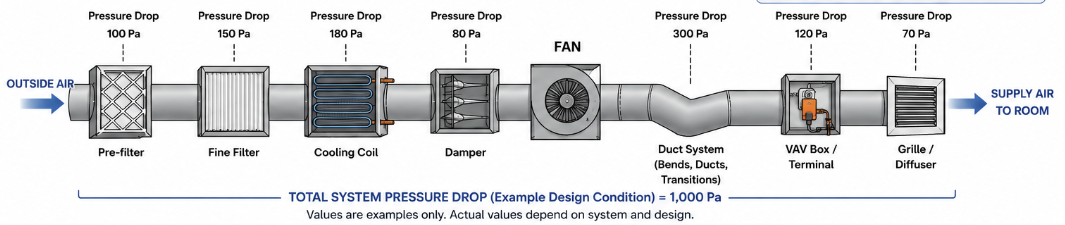
For example, consider an AHU with a design fan pressure of 1,000 Pa.
A simplified pressure budget may look like:
| Component | Pressure Drop |
|---|---|
| Pre-filter | 100 Pa |
| Fine filter | 150 Pa |
| Cooling coil | 180 Pa |
| Dampers | 80 Pa |
| Duct system | 300 Pa |
| Terminal devices | 120 Pa |
| Other losses | 70 Pa |
| Total | 1,000 Pa |
This is only an example. Actual values depend on the equipment and design.
The important concept is that the fan does not “lose” pressure at one location.
The pressure is consumed across the complete air path.
During an energy audit, this pressure budget is extremely useful.
If the design pressure was 1,000 Pa but the actual operating pressure is 1,300 Pa, the next question should be:
Where did the additional 300 Pa come from?
That question is much more useful than simply increasing the fan speed.
5. Fan Power: Why Static Pressure Matters to Energy
The basic fan power relationship is:
where:
- (Pfan) = fan input power
- (Q) = airflow in m³/s
- (ΔP) = fan pressure rise in Pa
- (η) = overall fan and motor efficiency
For example:
Airflow:
Assume:
and overall efficiency:
Then:
Now suppose the system pressure requirement increases to 1,300 Pa while maintaining the same airflow.
The airflow has not increased.
The cooling capacity has not necessarily increased.
But the fan power has increased by approximately:
This is the practical reason static pressure deserves attention during an energy audit.
6. Fan Affinity Laws
For geometrically similar operating conditions, the fan affinity relationships are:
Airflow:
Pressure:
Power:
where (N) is fan speed.
These relationships explain why fan-speed changes can have a large impact on power.
For example, if fan speed increases by 10%:
The theoretical pressure relationship becomes:
and power:
So, under the affinity-law assumptions, a 10% speed increase can mean approximately
Theoretical pressure: +21%
Theoretical power: +33.1% higher fan power.
However, this should not be interpreted as a universal rule for every VFD or ECM fan.
Actual operating behaviour depends on:
- Fan curve
- System curve
- Fan efficiency
- Motor efficiency
- VFD losses
- Control strategy
- Actual airflow
- Operating point
This distinction is important when analysing real AHU data.
7. Fan Curve and System Curve: The Missing Link
A fan does not operate at one fixed pressure and airflow.
Its actual operating point is determined by the intersection of:
Fan curve + System resistance curve
The system resistance approximately follows:
This means that increasing airflow can require a disproportionately higher pressure.
For example, if airflow increases by 10%:
Then approximately:
So pressure requirement can increase by approximately 21%.
This is why simply increasing airflow is not a free improvement.
The fan power requirement can rise quickly.
For an energy engineer, the objective should therefore not be:
“How much airflow can I get?”
It should be:
“What is the minimum fan pressure and power required to deliver the required airflow?”
8. Where Does the Pressure Actually Go?
During troubleshooting, divide the system into sections.
AHU Components
Check:
- Pre-filter DP
- Fine-filter DP
- Cooling coil DP
- Heating coil DP
- HEPA filter DP
- Humidifier or other accessories
- Dampers
Duct System
Check:
- Main duct pressure loss
- Branch losses
- Elbows
- Transitions
- Flexible duct
- Dampers
- Volume control devices
Terminal Devices
Check:
- VAV boxes
- Grilles
- Diffusers
- HEPA terminals
- Control dampers
This approach creates a pressure-loss map.
Instead of saying:
“AHU static pressure is high.”
You can say:
“The AHU requires 1,250 Pa. Approximately 180 Pa is being consumed by filters, 220 Pa by the cooling coil and 540 Pa by the distribution system. The remaining losses need further investigation.”
That is an engineering diagnosis.
9. High Air Velocity: A Common Hidden Problem
Duct sizing is not only about fitting the required airflow into the available space.
Velocity matters.
As velocity increases:
- Pressure loss increases
- Fan power increases
- Noise increases
- Flow distribution can deteriorate
For a given airflow:
If duct area decreases, velocity increases.
For example, reducing duct area by 20% increases velocity by:
So velocity increases by approximately 25%.
Since many pressure losses are related to velocity squared, the pressure-loss impact can be significant.
This is why reducing duct size to save initial project cost can create a recurring operating-cost penalty.
10. Flexible Duct: Installation Quality Matters
Flexible duct is particularly sensitive to installation.
A properly selected flexible duct can perform satisfactorily.
A poorly installed one can create significant additional pressure loss.
Common field conditions include:
- Excessive bends
- Sagging
- Compression
- Long unsupported sections
- Sharp turns
- Kinks
- Poor connections
Therefore, it is not good practice to use one universal correction factor for all flexible duct.
The pressure loss should be checked using the manufacturer’s data and the actual installation condition.
In an existing facility, visual inspection is often the first step.
A 100% open damper does not mean the duct system is low resistance.
The duct geometry itself may be the problem.
11. Cooling Coil and Filter Pressure Drop
Filters and coils are often treated as fixed pressure losses.
They are not.
Filter pressure drop increases with:
- Dust loading
- Airflow
- Filter type
- Face velocity
Cooling coil pressure drop depends on:
- Airflow
- Coil face velocity
- Number of rows
- Fin spacing
- Coil geometry
- Wet/dry condition
- Fouling
This creates an important operational issue.
A new filter may have a relatively low pressure drop.
The same filter after months of operation can have significantly higher pressure drop.
Therefore:
Filter DP should be trended, not just checked during maintenance.
The same principle applies to cooling coil DP.
12. HEPA Filters in Cleanroom HVAC
In pharmaceutical HVAC systems, HEPA filters can become a major part of the static-pressure budget.
The issue is not simply whether the HEPA filter is clean or dirty.
The complete system needs to be considered:
AHU → duct → terminal HEPA → room → return
If HEPA pressure drop increases over time, the supply fan may increase speed to maintain airflow or room pressure.
If the BMS is configured for constant pressure or airflow, the increase may remain hidden.
The operator sees:
Room pressure maintained.
The energy engineer sees:
Fan frequency increased from 42 Hz to 48 Hz.
That difference is where energy-saving opportunities often exist.
13. VFD Hunting and Static Pressure Control
Another common issue is improper static-pressure control.
For example, an AHU fan is controlled to maintain:
800 Pa duct static pressure
The pressure sensor is installed too close to the fan.
The system has multiple branches with different loads.
As dampers modulate, the fan repeatedly increases and decreases speed.
The result can be:
- VFD hunting
- Unstable airflow
- Higher fan power
- Poor control
- Unnecessary pressure
The solution is not always a higher or lower setpoint.
First verify:
- Sensor location
- Sensor calibration
- Control deadband
- PID tuning
- Setpoint
- Critical-zone requirements
- Damper operation
A well-designed static-pressure reset strategy can reduce fan energy significantly while maintaining the required terminal conditions.
14. Static Pressure Reset: An Energy-Saving Opportunity
In variable-air-volume systems, maintaining a fixed high static-pressure setpoint throughout the year is often unnecessary.
Suppose the system operates at:
Design static pressure = 1,000 Pa
But during part-load operation, the most-open VAV damper only requires:
650 Pa
Maintaining 1,000 Pa continuously means the fan is creating pressure that the system does not need.
A better control strategy is to reset the duct static-pressure setpoint based on the most-open critical terminal or another validated control variable.
For example:
If critical VAV damper position < 70% → reduce static-pressure setpoint.
If critical VAV damper position > 90% → increase static-pressure setpoint.
The actual limits should be established during commissioning.
This is a classic example where controls optimization can reduce energy without changing the HVAC equipment.
15. A Practical Field Measurement Sequence
When investigating high static pressure, do not immediately change the fan setpoint.
Follow a structured sequence.
Step 1: Record operating conditions
Record:
- AHU airflow
- Supply air temperature
- Return air temperature
- Fan Hz/RPM
- Motor kW
- Supply static pressure
- Return static pressure
- Filter DP
- Coil DP
Step 2: Check the filters
Compare actual filter DP against:
- Clean condition
- Manufacturer recommendation
- Previous trend
Step 3: Check the coil
Measure coil pressure drop.
Look for:
- Fouling
- Blocked fins
- Excessive face velocity
- Incorrect airflow
Step 4: Check the duct system
Inspect:
- Dampers
- Bends
- Flexible duct
- Transitions
- Branches
- Terminal devices
Step 5: Check airflow
Measure actual airflow using an appropriate calibrated instrument.
Do not assume that fan frequency equals airflow.
Step 6: Compare against design
Compare:
Design airflow vs actual airflow
and
Design pressure vs actual pressure
Step 7: Check fan operating point
Use the manufacturer’s fan curve where available.
The objective is to determine whether the fan is operating close to its intended duty point.
16. A Simple Energy Audit Example
Consider an AHU:
Airflow = 20,000 CMH
Actual fan pressure = 1,300 Pa
Overall fan efficiency = 65%
Fan power:
Now assume an optimization reduces system pressure to:
900 Pa
while maintaining the same airflow.
Then:
If the AHU operates 8,000 hours per year:
This is why pressure optimization should be included in an HVAC energy audit.
The saving does not come from reducing required airflow.
It comes from reducing unnecessary resistance while maintaining the required airflow and environmental conditions.
17. Common Mistakes Seen During Site Audits
Mistake 1: Increasing fan speed to solve low airflow
This treats the symptom.
First identify the restriction.
Mistake 2: Using a high static-pressure setpoint “for safety”
A higher setpoint is not automatically safer.
It can simply increase fan power.
Mistake 3: Ignoring filter DP
A filter is a pressure-consuming component.
Its DP should be trended.
Mistake 4: Looking only at AHU fan power
Fan kW alone does not tell you whether the system is efficient.
Always relate:
kW + airflow + pressure + operating condition
Mistake 5: Assuming design and actual conditions are identical
They rarely are.
The installed system needs to be measured.
Mistake 6: Balancing without finding the root cause
If one branch has low airflow because of excessive resistance, closing other dampers may temporarily improve balance but does not solve the underlying problem.
18. Static Pressure Should Be a BMS Trend
For critical HVAC systems, the following parameters should ideally be trended:
- Fan frequency
- Fan kW
- Supply static pressure
- Return static pressure
- Filter DP
- Coil DP
- Supply airflow
- Supply air temperature
- Return air temperature
- Critical zone pressure
- Damper position
The real value comes from looking at these parameters together.
For example:
Filter DP ↑ + Fan Hz ↑ + Fan kW ↑ + Airflow constant
This is a strong indication that the fan is compensating for increasing resistance.
Similarly:
Fan Hz ↑ + Static pressure ↑ + Airflow unchanged
should trigger an investigation rather than simply accepting the higher fan speed.
19. The Real Optimization Strategy
Static-pressure optimization should follow this sequence:
Measure → Identify pressure consumer → Correct restriction → Rebalance → Reduce fan pressure → Verify airflow → Verify room conditions → Quantify energy saving
Do not start with:
Reduce fan speed.
Reducing fan speed without understanding the system can create:
- Low airflow
- High room temperature
- RH problems
- Cleanroom pressure loss
- Process issues
- Poor air distribution
The objective is not to operate the fan at the lowest possible speed.
The objective is to operate the HVAC system at the lowest practical pressure and fan power required to meet the process and environmental requirements.
20. Key Operational Takeaway
Static pressure is often treated as a number displayed on a manometer or BMS screen.
It should be treated as a diagnostic and energy-performance parameter.
If an AHU is consuming more fan power than expected, do not immediately blame the motor or VFD.
Look at the complete air path.
Ask:
- Is the filter DP increasing?
- Is the coil fouled?
- Is the duct system creating excessive resistance?
- Are dampers properly positioned?
- Is the fan operating away from its design point?
- Is the static-pressure setpoint unnecessarily high?
- Is the sensor correctly located?
- Is the airflow actually required?
- Can the static-pressure setpoint be reset during part-load operation?
The most effective HVAC optimization is often not about installing a new fan or replacing the AHU.
Sometimes the solution is much simpler:
Reduce the resistance.
Every Pascal of unnecessary pressure that the fan has to generate eventually becomes an energy cost.
Measure the pressure.
Find where it is being consumed.
Correct the root cause.
Then reduce the fan pressure and verify the result.
That is how static-pressure analysis becomes an actual energy-saving exercise rather than just another HVAC measurement.
EnerShares Engineering Note
Static-pressure values, airflow requirements and fan operating points are system-specific. Actual optimization should be based on measured field conditions, manufacturer fan curves, design requirements and applicable HVAC/cleanroom standards. For critical HVAC systems, any airflow or pressure reduction should be verified against temperature, RH, room-pressure and process requirements before implementation.
⚡ Enjoying this article? Stay updated with weekly HVAC & Energy Hacks — straight on WhatsApp!
💚 Join Our WhatsApp Channel