
In any modern plant, energy is far more than a line item on the utility bill—it is a network that binds every operation together. Understanding how that network works is the first step toward true energy efficiency and operational excellence.
1 | The Energy Facility / Utility Block – Where Conversion Happens
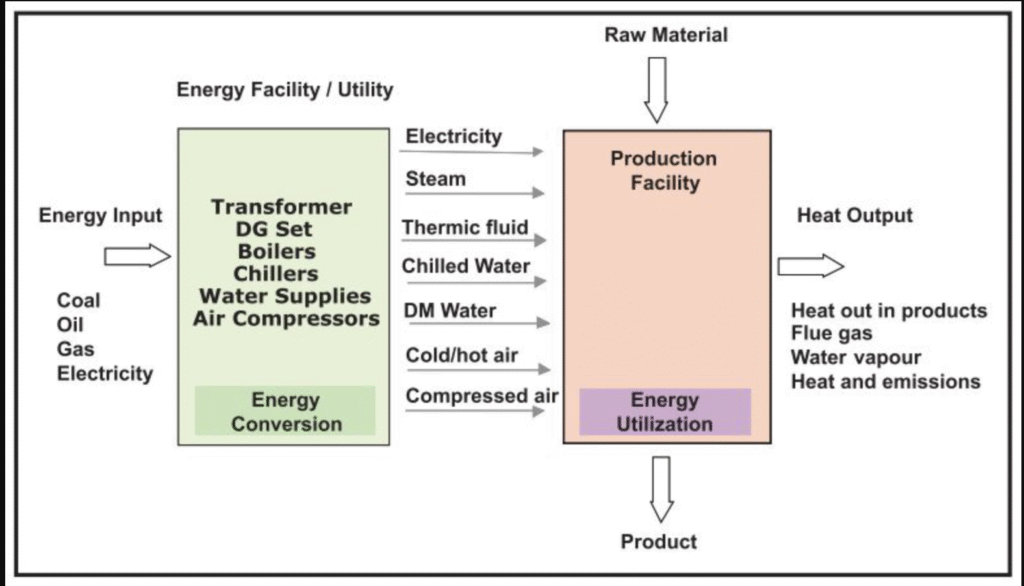
Before a kilowatt‑hour or kilogram of steam can do useful work, primary fuels must be converted into plant‑ready utilities. Typical conversion assets include:
| Conversion Asset | Primary Function |
|---|---|
| Transformers & DG sets | Generate or condition electrical power |
| Boilers | Raise steam or circulate thermic fluid |
| Chillers | Produce chilled water for HVAC & process cooling |
| Water‑treatment & supply systems | Deliver de‑mineralised (DM) water and cooling water |
| Air compressors | Supply compressed air and, via air dryers/heaters, cold/hot air |
From these assets we obtain the utility “toolkit” the plant relies on every minute: electricity, steam, thermic fluid, chilled water, high‑purity or cooling water, conditioned air, and compressed air.
2 | The Production Facility – Where Utilization Happens
On the production side of the fence, those utilities are consumed by dozens of operations:
- Heating & drying (reactors, ovens, evaporators)
- Cooling & refrigeration (jackets, condensers, HVAC)
- Mechanical work (motors, pumps, material‑handling equipment)
- Instrumentation & controls (pneumatic actuators, sensors)
Every finished product coming off the line has an invisible energy footprint that traces back to the utility block.
3 | Heat & Energy Losses – The Unwanted By‑Products
Conversion and utilization are never 100 % efficient. Common loss channels include:
- Flue gases leaving boilers and DG sets
- Water vapour from cooling towers and vents
- Direct heat emissions from hot surfaces and un‑insulated piping
- Residual energy in products (hot liquids, warm compressed air, etc.)
Quantifying these losses is the first diagnostic step of any credible energy audit.
4 | Why a System Approach Works
Grouping plant utilities into three logical tiers—generation, distribution, utilization—creates a simple yet powerful roadmap:
| Tier | Typical Questions to Ask | Benefits |
|---|---|---|
| Generation | Are boilers and chillers right‑sized? What is boiler blow‑down rate? | Reduce conversion losses, optimise load sharing |
| Distribution | Are steam/condensate lines insulated? Any air leaks? | Cut line losses, stabilise pressure & temperature |
| Utilization | Is equipment using the right utility at the right quality? | Eliminate oversized motors, reclaim waste heat |
A structured audit of each tier reveals hidden inefficiencies and highlights the best ROI projects—whether that is adding variable‑speed drives, recovering flash steam, or upgrading insulation.
Conclusion
Energy is not merely a cost centre; it is the bloodstream of industrial production. Once you map how it is generated, distributed, used, and lost, you gain the leverage to trim waste, cut emissions, and boost reliability—all without compromising throughput.
Start by drawing your own facility diagram. The insights will surprise you.
#EnergySystem #UtilityManagement #EnergyEfficiency #Enershare #EnergyAudit #IndustrialUtilities #SystemApproach #EnergyManagement
Really helpful
Really very helpful for energy saving in daily life.
Thank You Sridhar for your Feedback. I am committed to share more ideas in near future.