

Introduction
Welcome to the Level 2 guide for Mechanical, Electrical, and Plumbing (MEP) professionals. This resource is crafted for the experienced engineer who has moved beyond foundational principles and now requires a quick, dependable reference for sanity-checking designs before committing to resource-intensive simulations. It bridges the gap between textbook theory and project site reality, building upon basic thumb rules with field-tested insights and a global perspective that considers standards like ASHRAE (American Society of Heating, Refrigerating and Air-Conditioning Engineers), ECBC (Energy Conservation Building Code, India), and DIN EN (German Institute for Standardization/European Standards).
Whether you’re specifying a rooftop unit for a commercial space in Texas, navigating the complexities of a heritage building retrofit in Berlin, managing a district cooling connection in Dubai, or engineering for grid instability in Delhi, these guidelines are designed to reflect the dynamic challenges that arise on-site. They acknowledge that a perfect design on paper can be compromised by unforeseen site conditions. This guide is your second opinion, a repository of practical wisdom that accounts for the nuances that software models often miss.
Disclaimer: These thumb rules and formulas are intended for preliminary design, feasibility studies, and cross-verification by experienced practitioners. They are not a substitute for detailed engineering analysis, comprehensive energy modeling, or rigorous adherence to local, national, and international building codes. All final designs must be validated through full simulations and comply with all jurisdictional requirements.
1. Refined Cooling Load Breakdown: Beyond the Basics
A precise cooling load calculation is the bedrock of any successful HVAC design. Simply applying a generic watts-per-square-meter value is a recipe for failure. Breaking the load into its Sensible (temperature-related) and Latent (humidity-related) components is non-negotiable for right-sizing equipment and ensuring occupant comfort, especially in climates where either humidity or internal equipment density dominates the thermal landscape.
| Component | Condition | Estimate (BTU/hr·sq ft) | Field Constraints & Global Insights |
| Glazing | Standard, Sun-facing | 35–50 | In the extreme solar conditions of the Middle East, an unshaded, standard single-pane glass facade can single-handedly spike the cooling load by 25–30%. Retrofit solar films offer a solution, but their real-world performance rarely matches the manufacturer’s specification sheet due to application imperfections and degradation. When specifying glass, look beyond the marketing terms. In the USA, reference NFRC (National Fenestration Rating Council) ratings for Solar Heat Gain Coefficient (SHGC) and U-factor. In Germany, DIN standards for g-value (equivalent to SHGC) are paramount. |
| Low-E, High-performance | 20–30 | High-performance glazing is a powerful tool, but its effectiveness is contingent on availability. In many developing regions, specifying advanced triple-pane units with specific gas fills and coatings can introduce significant project delays and supply chain risks. Always verify local availability and lead times. | |
| Lighting | LED | 3–4 | This figure accounts for the heat from the lamp itself. However, the true load is often higher. In compact or poorly ventilated ceiling voids, the heat generated by LED drivers can be substantial and is frequently overlooked in initial estimates. A field measurement might reveal that the total lighting load is 10-15% higher than calculated. |
| Fluorescent | 5–7 | When surveying older buildings for retrofits, be wary of taking spot readings of fluorescent lighting loads. Lamp and ballast performance degrades unevenly over time, which can skew your survey data and lead to underestimation of the true load once new, full-output fixtures are installed. | |
| Equipment | Standard Office | 3–5 | This baseline covers typical workstations (laptop, monitor, phone). However, always conduct a walk-through to identify “ghost loads” — vending machines, large-format printers, coffee stations, and AV equipment in conference rooms that are often omitted from initial floor plans. |
| High-Density | 10–20+ | This applies to trading floors, broadcast studios, or labs. The biggest risk here is future load creep. A data closet or small server room’s load can easily double when the IT department adds new servers or switches without consulting facilities management. For critical spaces, it’s wise to design with a 25% buffer for future equipment density. | |
| Occupants | Sensible (Seated) | 225–250 BTU/hr per person | This ASHRAE standard is a baseline. In colder climates like Germany or the northern USA, office workers may wear heavier clothing, slightly reducing their heat loss to the space and thus lowering the sensible load per person during the heating season. Conversely, activity levels are critical: a person walking contributes ~450 BTU/hr, while someone exercising can exceed 1000 BTU/hr. |
| Latent (Moisture) | 150–200 BTU/hr per person | This load is a primary driver of coil sizing in humid climates. In places like Dubai or Mumbai, the latent load from occupants and ventilation air can constitute over 40% of the total cooling load, demanding deeper cooling coils with more surface area to effectively dehumidify the air. |
Site Reality: The Infiltration Factor Infiltration—uncontrolled air leakage through cracks, gaps, and door openings—is a silent capacity killer. In humid or extremely hot climates, infiltration can account for over 15% of the total cooling load. In high-rise buildings, the stack effect can create significant pressure differences, pulling massive amounts of unconditioned air into the lower floors during winter and forcing conditioned air out of the upper floors (and vice-versa in summer). A blower door test, while not a thumb rule, is an invaluable diagnostic tool during commissioning to quantify the building envelope’s leakiness.
2. Air Systems & Psychometrics: Engineering the Air
Understanding the thermodynamic properties of moist air is what separates an HVAC technician from an HVAC engineer. Psychrometrics governs comfort, efficiency, and equipment selection.
Sensible Heat Ratio (SHR)
The SHR is the ratio of sensible load to total load (SHR=Qsensible/Qtotal). It is the single most important factor in selecting the right cooling coil.
- Dry Climates / Data Centers (SHR: 0.90–0.95): The load is almost entirely sensible. The goal is temperature reduction with minimal dehumidification. Getting this wrong can lead to over-cooling or, in winter, excessively dry conditions that cause static electricity and occupant discomfort.
- Standard Office Comfort (SHR: 0.75–0.85): This is the typical design baseline defined by ASHRAE, balancing temperature and humidity control.
- Humid Climates / High Occupancy (SHR: 0.65–0.75): Spaces like restaurants, gyms, and auditoriums have significant latent loads from people and processes. A standard coil selected for an SHR of 0.85 will fail to remove enough moisture, leading to a clammy, uncomfortable environment and potential mold growth, even if the thermostat setpoint is met.
Key Formulas & Field Checks
Supply Air Temperature Formula:
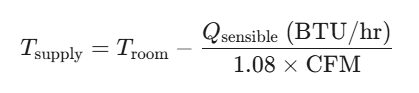
The constant 1.08 is a product of the density of standard air (~0.075 lb/ft³), the specific heat of air (~0.24 BTU/lb·°F), and 60 minutes/hour.
- Typical Supply Air: 12–14 °C (54–57 °F).
- Reality Check: This formula calculates the temperature of the air leaving the coil. In large buildings, duct runs from a rooftop AHU to a ground-floor zone can be hundreds of feet long. Even with good insulation, duct heat gain through unconditioned plenums can raise the supply air temperature by 1–2 °C (2–4 °F) by the time it reaches the diffuser. This often overlooked factor can be the difference between meeting the load and falling just short.
Airflow Calculation:
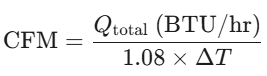
Where ΔT is the difference between the return and supply air temperatures.
Field Tip: Engineers are often tempted to use a high ΔT (e.g., >20 °F) to reduce the required CFM, which in turn reduces fan energy and duct sizes. While this looks efficient on paper, it’s a significant risk. At part-load conditions, VAV (Variable Air Volume) systems will throttle down the fan. A high design ΔT means the supply air is very cold. At low airflows, this cold, dense air can “dump” directly downwards from the diffuser instead of mixing with the room air, creating uncomfortable drafts and poor air distribution. Keeping the design ΔT in a more moderate 16–18 °F range provides a more resilient and comfortable system.
3. Smarter Duct Design & Static Pressure
Efficient air delivery is as crucial as efficient air conditioning. The goal of duct design is to move the right amount of air to the right place with the least resistance and noise. The Equal Friction Method is a reliable thumb rule for designing balanced and efficient duct systems.
- Low-Pressure Systems (<2 in. wg): Target a friction loss rate of 0.08–0.10 in. wg per 100 ft of duct. This is typical for small commercial and residential systems.
- Medium-Pressure Systems (2–6 in. wg): Use a rate of 0.10–0.60 in. wg per 100 ft. This applies to larger systems where duct runs are longer and velocities are higher.
Estimated Fan External Static Pressure (ESP) Breakdown
The fan’s job is to overcome the total resistance of the system. Underestimating ESP is a common design error, leading to undersized fans that fail to deliver the required airflow.
| Component | Typical Pressure Drop (in. wg) | On-Site Insight |
| Filters (MERV 8-13) | 0.30 – 0.75 | This value is for a dirty filter. Always design for the final resistance, not the initial. In dusty environments like construction sites or locations in the Middle East, filters can clog much faster than scheduled, sometimes doubling the pressure drop and crippling airflow if not monitored. |
| Cooling Coil (4-6 Row) | 0.40 – 0.80 | The pressure drop across a coil increases significantly when it’s wet (dehumidifying) compared to when it’s dry. Always use the manufacturer’s wet coil data for summer design conditions. |
| Heating Coil | 0.10 – 0.20 | Generally a lower pressure drop than the cooling coil due to wider fin spacing. |
| Sound Attenuator | 0.15 – 0.30 | There’s a direct trade-off between acoustic performance and pressure drop. Specifying a lower NC (Noise Criteria) level often requires a more restrictive attenuator. |
| Supply & Return Ductwork | 0.50 – 1.00+ | This is the most variable component. A complex layout with many bends and transitions will have a much higher pressure drop than a straight run. Fire-rated duct wrap, required in many jurisdictions, adds significant weight and can cause duct sag, altering the airflow dynamics and requiring more robust hanger supports. |
| Diffusers & Grilles | 0.05 – 0.15 | This value is dependent on the diffuser’s “throw” and “spread” characteristics. High-throw diffusers often have higher pressure drops. |
| Estimated Total ESP | 1.50 – 3.20 | This is a typical range. Always sum the components for your specific system; never assume a generic value. |
4. Hydronics & Pump Efficiency: The Circulatory System
For larger systems, chilled water is the lifeblood. Efficiently pumping that water is key to operational savings.
Pump Affinity Laws (for VFDs)
Variable Frequency Drives (VFDs) are essential for energy efficiency in variable-flow hydronic systems. The affinity laws demonstrate their power:
- Flow (Q) is proportional to Speed (N): Q2/Q1=N2/N1
- Head (H) is proportional to the square of the Speed: H2/H1=(N2/N1)2
- Power (P) is proportional to the cube of the Speed: P2/P1=(N2/N1)3
The takeaway is profound: a small reduction in pump speed yields a massive reduction in energy consumption. Slowing a pump by just 20% (to 80% speed) reduces its power draw by nearly 50% (0.8³ = 0.512).
Practical Constraints & Diversity
- Commissioning is Key: The best pump and VFD are useless if the piping system is compromised. In dusty construction environments, especially prevalent in the rapidly developing Middle East, inadequate pipe flushing before system startup is a chronic problem. Debris left in the pipes can cause immediate damage to control valve seats and premature erosion of pump impellers, leading to early failure. Insisting on a thorough, multi-day flushing protocol compliant with BSRIA (Building Services Research and Information Association) standards is critical.
- Specialized Environments: In sensitive facilities like USA hospitals, the routing of chilled water pipes is heavily scrutinized. Infection Control Risk Assessment (ICRA) protocols dictate how and when penetrations through walls are made, often requiring containment tents and specific work hours, which can significantly impact project timelines and budgets.
- Chiller Plant Diversity: A diversity factor is an engineering judgment on the maximum percentage of the total connected load that will likely occur at the same time. A diversity factor of 0.80–0.90 is a common starting point for a mixed-use commercial building. However, this must be applied with caution. A German office building with a highly uniform usage pattern may exhibit a diversity factor greater than 0.95. Conversely, a hotel with varied guest occupancy might have a diversity as low as 0.65. Applying the wrong diversity factor directly leads to an oversized (or undersized) and inefficient central plant.
5. Energy Metrics & System Choices: Matching Hardware to the Mission
Choosing the right core system technology depends on capacity, budget, efficiency goals, and site constraints.
kW/TR Benchmarks
A ton of refrigeration (TR) is the rate of heat removal equal to 12,000 BTU/hr. The kW/TR metric is the universal measure of chiller efficiency. Lower is better.
| Chiller Type | Typical Efficiency (kW/TR) | Best Application |
| Air-Cooled | 0.90 – 1.20 | Midsized buildings, areas with water scarcity or restrictions. |
| Water-Cooled (Standard) | 0.55 – 0.75 | Large buildings, campuses, data centers with available makeup water. |
| Water-Cooled (Magnetic Bearing) | 0.30 – 0.50 | High-efficiency green buildings, projects with a low tolerance for noise/vibration. |
Operational Reality: The choice has long-term financial consequences. In Middle East district cooling schemes, facilities are often billed based on a contracted capacity (TR), in addition to consumption (ton-hours). Oversizing the building’s secondary plant based on overly conservative load calculations means the client pays for capacity they will never use, year after year. This creates a powerful incentive for right-sizing.
System Selection Guideline
| System Type | Capacity Range | Pros | Cons |
| VRF/VRV | 5 – 100 TR | High part-load efficiency, individual zone control, heat recovery options. | Long refrigerant piping runs can be complex to design and install; higher upfront cost per ton; refrigerant leak detection and management is critical. |
| Air-Cooled Chiller | 50 – 500 TR | Simpler installation (no cooling tower), reduced maintenance, good for water-scarce regions. | Lower efficiency (especially in high ambient temperatures), higher operating noise, larger physical footprint. |
| Water-Cooled Chiller | 200 – 5000+ TR | Highest full- and part-load efficiency, long service life, can be located indoors to reduce noise. | High complexity, requires a cooling tower, condenser water pumps, and significant makeup water; intensive water treatment is required to prevent scale, corrosion, and Legionella risk. |
6. Ventilation – ASHRAE 62.1 Precision
Providing fresh outdoor air is mandatory for occupant health and cognitive function. ASHRAE Standard 62.1, “Ventilation for Acceptable Indoor Air Quality,” provides the definitive methodology.
The breathing zone outdoor airflow (Vbz) required is calculated as:
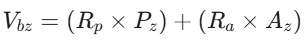
Where:
- Rp = Outdoor air rate required per person (from ASHRAE tables)
- Pz = Number of people in the zone
- Ra = Outdoor air rate required per unit area (from ASHRAE tables)
- Az = Zone floor area (in sq ft)
Example (1000 sq ft office, 10 people): Using standard office values (Rp=5 CFM/person, Ra=0.06 CFM/sf): Vbz=(5 CFM/p×10 p)+(0.06 CFM/sf×1000 sf) = 50+60=110 CFM
On-Site Insight: The Energy Penalty of Fresh Air In extreme climates, ventilation air is a massive energy load. In desert climates like Arizona or Dubai, bringing in 35-45°C outdoor air without any pre-treatment can double the cooling load attributed to ventilation. This makes Energy Recovery Ventilators (ERVs) or Enthalpy Wheels essential. An enthalpy wheel can recover over 70% of both the sensible and latent energy from the exhaust air stream, drastically reducing the size and operating cost of the main cooling equipment. However, they are not a “fit and forget” solution; they add static pressure to the system and require regular maintenance to ensure the wheel media remains clean and effective.
Conclusion & Next Steps
Textbook formulas provide the starting line, but world-class engineering happens in the field—where a congested ceiling void, a poorly executed duct transition, or an overloaded electrical feeder can force a complete redesign in minutes. This Level 2 guide was designed to arm you with the practical tolerances, regional sensitivities, and operational wisdom needed to ensure your designs are robust, efficient, and buildable.
The true mark of an expert engineer is the ability to foresee these challenges and design defensively. It’s the skill of blending the science of calculation with the art of practical application.
The journey continues. In Level 3, we will advance into the tools that define modern, high-performance building design: dynamic energy simulations (e.g., EnergyPlus™, IES-VE) to model annual performance, BIM-integrated load modeling to prevent on-site clashes, and comprehensive life-cycle cost optimization to guide investment decisions. Because the difference between a good design and a great one lies in the gap between knowing the numbers and making them work when the site fights back.